It has been almost a year since I joined the Rappi Artificial Intelligence team. It has been a blast, lots of highly complex challenges with big rewards. As part of my role, I have been giving talks on countless occasions, and even if I have to adjust my speech according to each audience background, I have more or less using the same deck. I decided to start writing a series of posts describing each section of this deck (AI_at_Rappi).
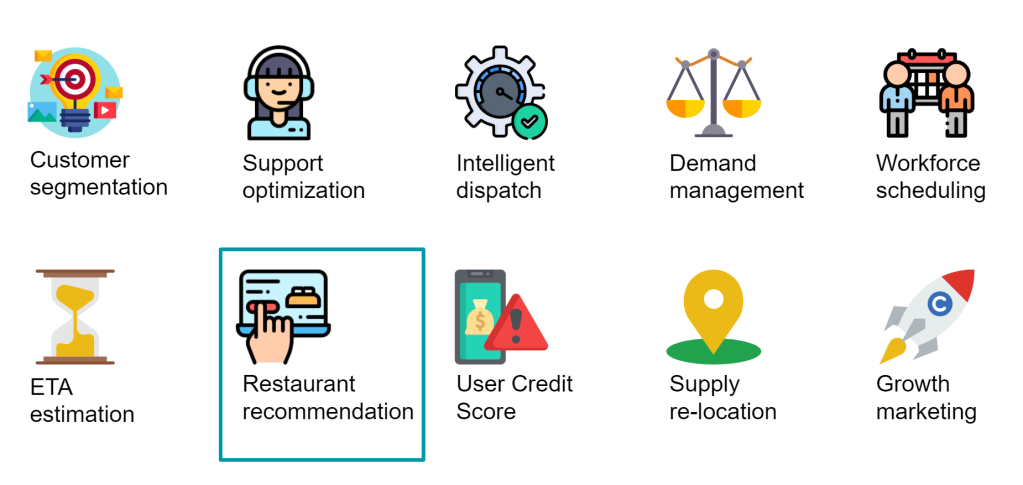
First a quick overview of the topics I’m planning to discuss over the next couple of weeks (or months):
In this post I’m going to discuss one that I found very exciting, that is how to recommend restaurants to users.
Before I begin, I must say that this is work done with the support of a lot of people. In particular, this work was mostly developed with Sergio Villegas.
Recommending similar restaurants
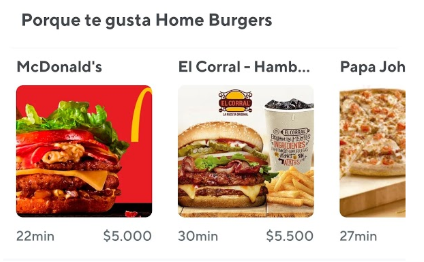
It is quite common when you’re making a purchase in a marketplace to find out a banner saying “because you liked … you might like …”. In the context of restaurants it means recommending a set of restaurants to a given user.
So how do you select which restaurants to show to a user. The naive approach is to show the most common restaurants given a certain category. However, that means not allowing users to discover new restaurants. Also, this assumes that all users might like the most common restaurant, but if for example you have a user that only orders from restaurants with vegan offerings, he might not want to receive a recommendation of a beef burgers.
One of the solutions is to offer personalized recommendations. For that, you want to figure out which restaurants are similar to the ones that a user has ordered before. That arises to a very complex question, how do you measure restaurant similarities? Think about that for a second. How can you estimate that two or more restaurants are similar? And how do you express that similarity in a number?
A typical solution is to analyze the menus of the restaurants. For example, we can extract the text of the menus, and compare how similar they are with a standard text similarity measure.
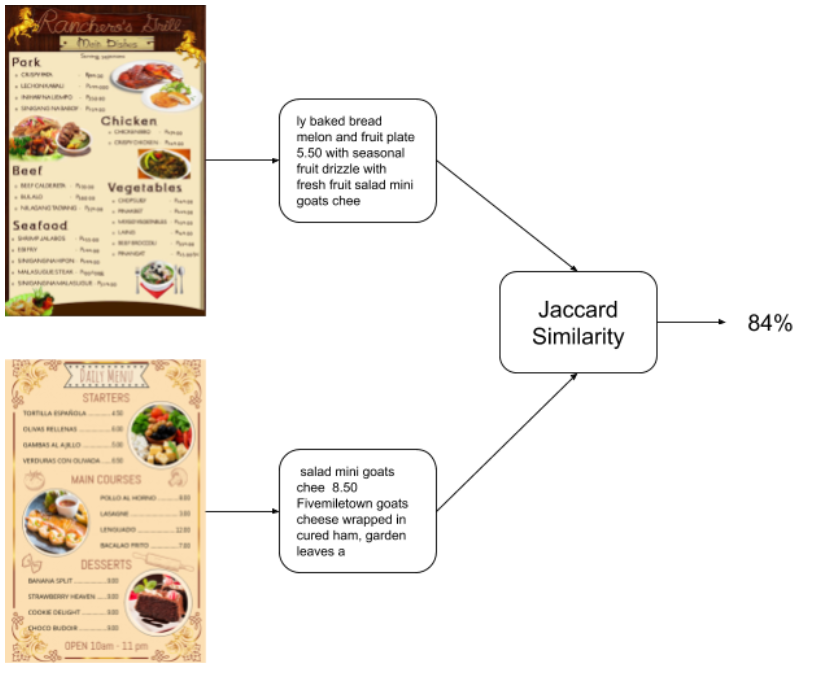
This is actually a good place to start. It does have some issues I’ll like to discuss:
- It is going to be biased towards common items (Burgers)
- May miss important information (Vegan Burger vs. Very Big Burger)
Some more complex issues:
- The algorithm will find similar restaurants that are not practically comparable. For example, if you have two restaurants that are very far apart from each other it doesn’t really matter that they are similar, as you’re not going to be able to do delivery of those two to the same customer.
- Also, two restaurants that do not open at the same time of day, it does not matter that they are similar, as you can not offer them to a customer at the same moment of time.
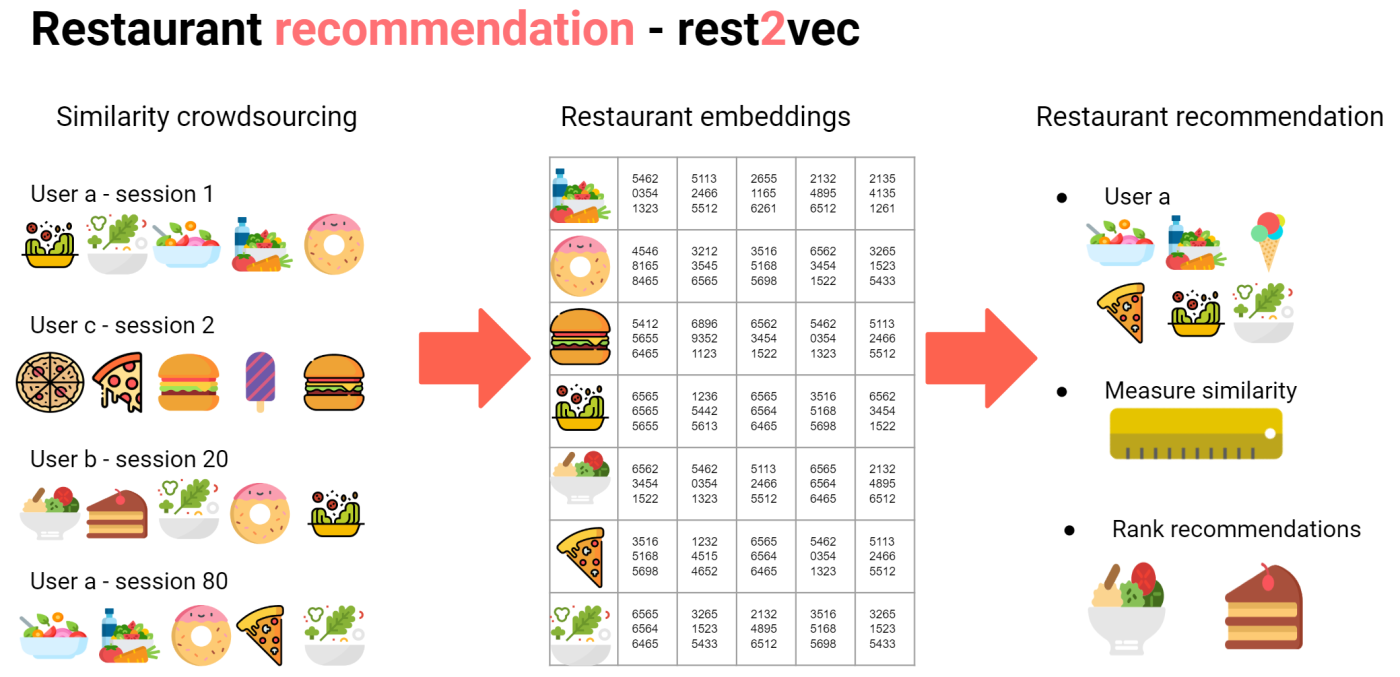
Rest2Vec
A different way to see the evaluation of a restaurant similarity is to understand what is a customer intent. This is something that you might actually observe doing simple experiments. One way is to randomize how restaurants are shown and observed which restaurant a user clicks on in a single session.
For example this image shows a typical session when I’m ordering lunch:
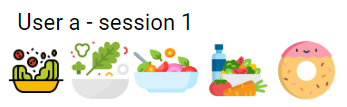
First, I start looking for fresh salads, bowls, and finally I order donuts . You may think there is not valuable information here, but the fact that I had the intent of ordering in those restaurants means that for me in that moment of time those restaurants were similar, or were going to fulfill the same job to me.
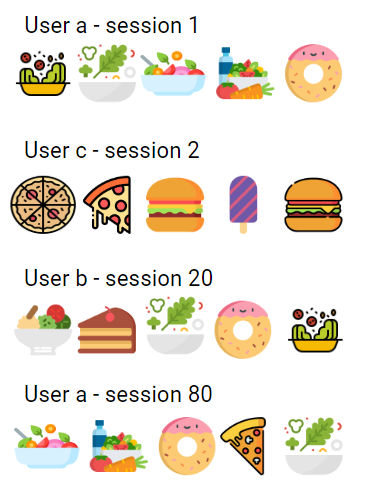
Following that same logic, we can collect several user sessions that are going to look something like this:
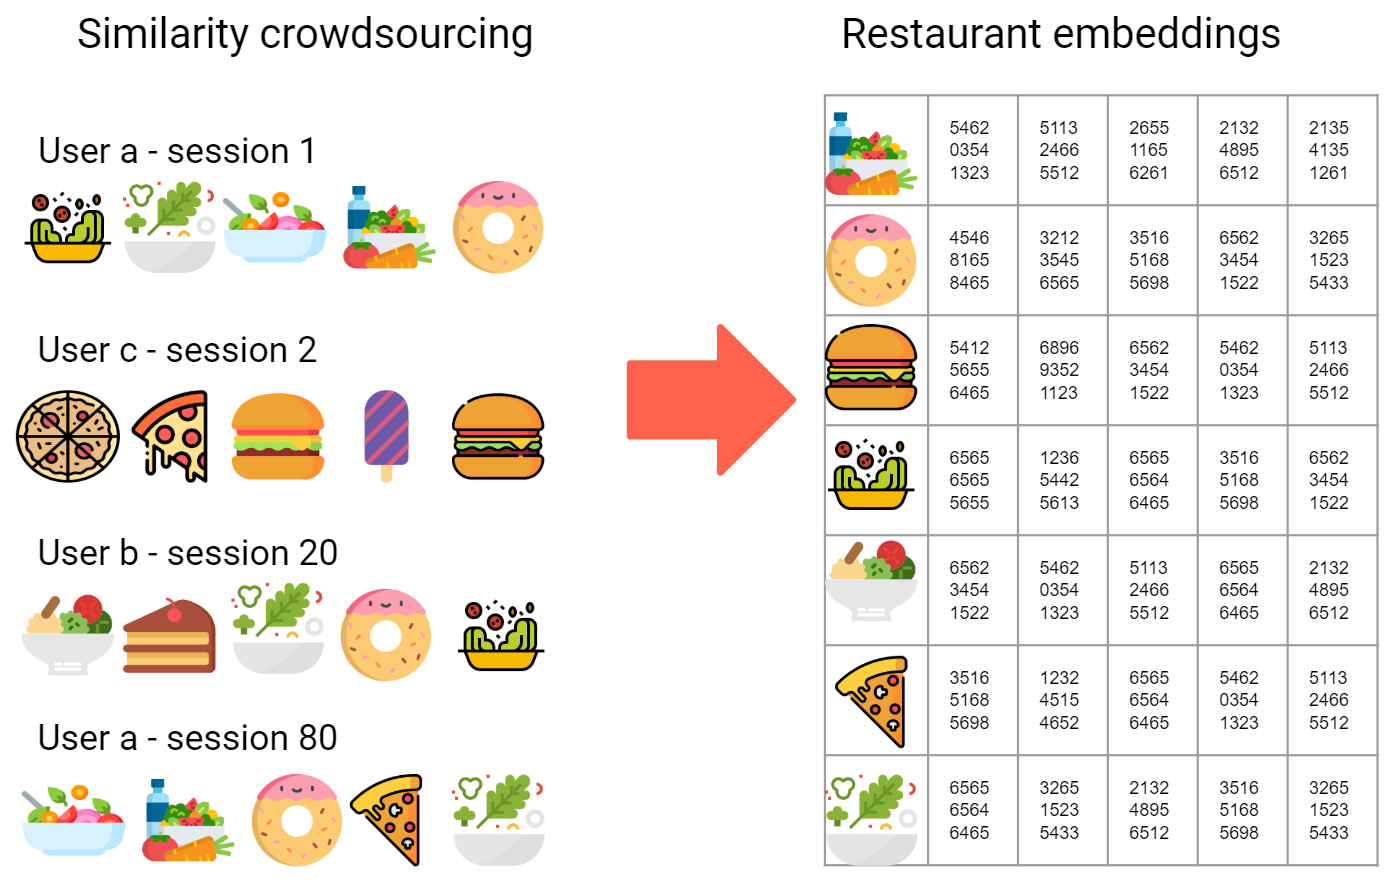
Then a simple way to encode these sessions is to represent them as strings of restaurants IDs. for example:
Applying the same logic to all the user sessions means we can create a big list of strings of same length (let’s say 5 IDs in each string). Once we encode the sessions in this way we can apply a standard algorithm such as word2vec to generate an embedding or vector representation of each restaurant.
With this trick, we can compare the restaurants to which a customer orders, with all the other restaurants. As a result, we obtain a ranking of the restaurants more similar to the ones he likes.
Simplifying the analisis, we can plot the restaurants the user normally orders at a given time of day.
Here the blue dot represents the average of those restaurant vectors.
Afterwards, we can compare the distance between the blue dot and other restaurants. This distance can be something as simple as the cosine similarity. The distance tell us how similar the restaurants are to the average of what the user likes.
Using this method, we can rank those restaurants that are more similar to the ones that a user likes.
